Notion of probability:
- An event is a particular result or set of results
- A possibility space is the set of all possible outcomes
- Fro equally likely outcomes, the probability of an event E is given by
Compound event probability:
"A measure of the likely-hood that a compound event will occur" Method of calculating compound event probability- Formulas
- Additive rule
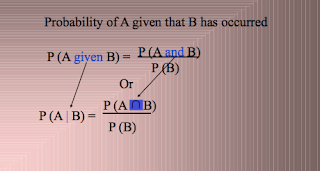
- Conditional probability formula
- Multiplicative rule
- Venn Diagram and Tree Diagram
Additive rule:
Mutually exclusive events:
- Both events cannot occur at the same time
- Both male and female for one person
- Both heads and tails for one coin toss
- No sample points in common(overlap)
- All female students who are Muslim in room 102
- All male students who are Christian in class room 103
Example:
additive rules for mutually exclusive events:
conditional probability"probability of one event occurring given that another event has occurred"
Characteristics
- Restrict original sample space to account for new information
- Assumes probability of given event ≠ 0
Conditional probability:
P( B | A ) represents the probability of event B occurring given that event A has already occurred.Suppose we draw two cards from a deck of 52.
Find the probability that the second card is a Jack given that the first card was a Jack and it was not replaced.
P( J2 | J1 ) = 3/51 ≈ 0.059
Find the probability that the second card is a Jack given that the first card was a Jack and it was replaced.
P( J2 | J1 ) = 4/52 = 1/13 ≈ 0.077
We can use the Multiplication Rule to calculate the probability of consecutive events.
P( A and B ) = P(A) ∙ P( B | A )
If events A and B are independent, then
P( A and B ) = P(A) ∙ P(B)
Conditional probability using Venn diagram:
Venn diagrams or set diagrams are diagrams that show all possible logical relations between a finite collection of sets (aggregation of things). Venn diagrams were conceived around 1880 by John Venn. They are used to teach elementary set theory, as well as illustrate simple set relationships in probability, logic, statistics, linguistics, and computer science.Multiplicative rule:
Independent events:
"The occurrence of one event does not influence the probability of another event"To test for independence:
- P (A|B) = P (A)
- P (B|A) = P (B)
- P (A ∩ B) = P (A) * P (B)
Tree Diagram:
"A branched picture of multiplicative rule and used for finding (A ∩ B)”Characteristics:
- Each set of branches is an event
- Each set of branches should add up to 1
- Multiply along each branch to find the probability of particular event
In a certain clothing shop, 40% of shoppers try on a jacket when browsing. Of those who try on jacket, 70% will subsequently purchase a jacket. However, 15% of browsers buy a jacket without trying on. What is the probability that a person who buys a jacket has tried one on?
Solution: Tree diagram
Let, Event (A) = customer tries on a jacket
Event (B) = Customer buys a jacket First,
Find P(A) and then P(A|B)


No comments:
Post a Comment